Expected goals. It’s a hockey metric used in hockey’s growing advanced analytics world. Expected goals, in short, is the chance that an unblocked shot becomes a goal. Hockey analytics experts tracked years of data to assign a value to unblocked shots originating from various points on the ice.
What this metric tells hockey fans, is which players are getting to the best scoring positions more often and getting unblocked shots to the net from those areas. The metric also considers the best shooting angles, and type of shot taken (Eg. Wrist Shot vs. Slapshot). It also allows coaches and scouts to see which players are scoring more than expected, and less than expected. A player who consistently, year over year, scores more than expected is likely a very skilled shooter. They would not only get to high potency shooting areas, but couple that with stronger and more accurate shots. Short term it could be luck, but year over year, the data speaks. Conversely, a player who regularly under performs their expected goals may be a weaker shooter, or as it may be, regularly faces better goaltenders. Whether they underperform or over-perform xG, the statistic has proven a reliable statistic for offensive production, and is a often a better indication of offensive potential compared to actual output based on a number of factors.
Here’s a look at the top players for expected goals per game, net expected goals per game, and total expected goals versus actual total goals for eligible prospects from the NCAA for the 2025 PWHL Draft. This data was compiled using InStat.
xG (per game) of NCAA Prospects for 2025 PWHL Draft
Originally a soccer metric, hockey co-opted the advanced statistic and applied it to the ice. Throughout a game, or season, a played accumulated expected goals totals. For example, a shot from the slot, ten feet from the net might accumulated a 0.3 expected goals (xG). That means that based on statistical models, a shot from that location should score 30% of the time. A shot from the blueline conversely, might only have an expected goals (xG) total of 0.05, meaning only five percent of shots from that location can be expected to score. Not only do these models factor in location, they also consider angle, and type of shot. For example, a slap shot from the left wall near the blueline will have a different value than a write shot from the same location.
Here’s a look at the top 25 PWHL Draft eligible players in the expected goals (xG) per game category from the 2024-25 NCAA season.
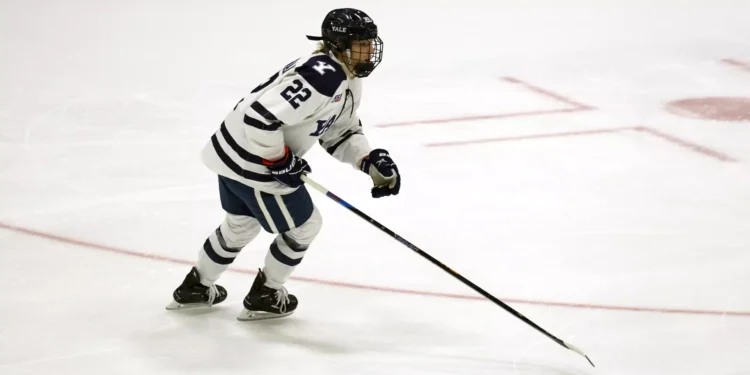
- Anna Bargman, Yale – 0.72
- Abbey Murphy, Minnesota – 0.68
- Lacey Eden, Wisconsin – 0.57
- Vanessa Upson, Mercyhurst – 0.56
- Kristyna Kaltounkova, Colgate – 0.55
- Jenna Buglioni, Ohio State – 0.55
- Casey O’Brien, Wisconsin – 0.54
- Jada Habisch, Connecticut – 0.53
- Morgan Neitzke, Lindenwood – 0.51
- Natalie Mlynkova, Minnesota – 0.51
- Makenna Webster, Ohio State – 0.50
- Emma Gentry, St. Cloud State – 0.50
- Olivia Wallin, Minnesota-Duluth – 0.50
- Anne Cherkowski, Clarkson – 0.49
- Kiara Zanon, Ohio State – 0.49
- Olivia Mobley, Minnesota-Duluth – 0.49
- Skylar Irving, Northeastern – 0.44
- Ella Huber, Minnesota – 0.44
- Brianna Brooks, Penn State – 0.44
- Lily Delianedis, Cornell – 0.43
- Abby Hustler, St. Lawrence – 0.43
- Sara Boucher, New Hampshire – 0.40
- Kira Juodikis, New Hampshire – 0.39
- Clara Van Wieren, Minnesota-Duluth – 0.38
- Brynn Saarela, Syracuse – 0.38
xG Net of NCAA Prospects for 2025 PWHL Draft
To look at a player’s ability to drive high quality scoring chances, and suppress high quality scoring while they’re on the ice, we can look at Net Expected Goals (Net xG). Net xG looks at the expected goals for a player and their team while they are on the ice, verses the expected goals of their opponents while they’re on the ice. It looks at the likelihood a goal is scored for, or against, while a specific player is on the ice.
Here’s a look at the top 25 PWHL Draft eligible players in the net expected goals (Net xG) per game category from the 2024-25 NCAA season.
- Makenna Webster, Ohio State – 1.04
- Lacey Eden, Wisconsin – 1.02
- Brianna Brooks, Penn State – 0.95
- Casey O’Brien, Wisconsin – 0.93
- Kiara Zanon, Ohio State – 0.93
- Anne Cherkowski, Clarkson – 0.87
- Jenna Buglioni, Ohio State – 0.85
- Haley Winn, Clarkson – 0.84
- Nicole Gosling, Clarkson – 0.84
- Anna Bargman, Yale – 0.82
- Kristyna Kaltounkova, Colgate – 0.79
- Maddi Wheeler, Ohio State – 0.74
- Lily Delianedis, Cornell – 0.61
- Karley Garcia, Penn State – 0.60
- Riley Brengman, Ohio State – 0.58
- Sidney Fess, Clarkson – 0.58
- Abbey Murphy, Minnesota – 0.55
- Olivia Muhn, Yale – 0.55
- Katie Chan, Cornell – 0.54
- Lyndie Lobdell, Penn State – 0.53
- Ella Huber, Minnesota – 0.51
- Marianne Picard, Wisconsin – 0.50
- Vanessa Upson, Mercyhurst – 0.49
- Vita Ponyatovskaia, Yale – 0.49
- Natalie Mlynkova, Minnesota – 0.45
Goals Above Expected of NCAA Prospects for 2025 PWHL Draft
This metric looks at the actual number of goals scored by players with the highest xG and Net xG (from above). Listed are their total actual goals, total xG, and the +/- differential between the numbers. Players are listed ranked based on actual goals scored this season.
| Rank | Name | School | Total Goals | Total xG | Difference |
| 1. | Abbey Murphy | Minnesota | 33 | 28.5 | + 4.5 |
| 2. | Casey O’Brien | Wisconsin | 26 | 20.4 | + 5.6 |
| 3. | Kristyna Kaltounkova | Colgate | 26 | 20.7 | + 5.3 |
| 4. | Lacey Eden | Wisconsin | 24 | 21.5 | + 2.5 |
| 5. | Abby Hustler | St. Lawrence | 19 | 16.9 | + 2.1 |
| 6. | Olivia Mobley | Minnesota-Duluth | 19 | 17.5 | + 1.5 |
| 7. | Anne Cherkowski | Clarkson | 17 | 19.7 | + 1.3 |
| 8. | Jenna Buglioni | Ohio State | 17 | 20.5 | – 3.5 |
| 9. | Clara Van Wieren | Minnesota-Duluth | 17 | 14.1 | + 2.9 |
| 10. | Skylar Irving | Northeastern | 17 | 13.3 | + 3.7 |
| 11. | Bryan Saarela | Syracuse | 17 | 14.7 | + 2.3 |
| 12. | Olivia Wallin | Minnesota-Duluth | 16 | 18.5 | – 2.5 |
| 13. | Natalie Mlynkova | Minnesota | 16 | 19.7 | – 3.7 |
| 14. | Peyton Hemp | Minnesota | 16 | 10.5 | + 5.5 |
| 15. | Jada Habisch | Connecticut | 16 | 19.1 | – 3.1 |
| 16. | Ella Huber | Minnesota | 15 | 18.5 | – 3.5 |
| 17. | Maya Labad | Quinnipiac | 15 | 18.7 | – 3.7 |
| 18. | Haley Winn | Clarkson | 14 | 13.9 | – 0.1 |
| 19. | Morgan Neitzke | Lindenwood | 14 | 15.9 | – 1.9 |
| 20. | Vanessa Upson | Mercyhurst | 13 | 20.6 | – 7.6 |
| 21. | Anna Bargman | Yale | 13 | 24.5 | – 11.5 |
| 22. | Nicole Gosling | Clarkson | 12 | 11.5 | – 0.5 |
| 23. | Emma Gentry | St. Cloud State | 13 | 17.7 | – 4.7 |
| 24. | Makenna Webster | Ohio State | 12 | 15.1 | – 3.1 |
| 25. | Kiara Zanon | Ohio State | 12 | 18.9 | – 6.9 |
| 26. | Lily Delianedis | Cornell | 12 | 14 | – 2.0 |
| 27. | Kira Juodikis | New Hampshire | 12 | 11.3 | + 0.7 |
| 28. | Brianna Brooks | Penn State | 11 | 16.5 | – 5.5 |
| 29. | Hannah Johnson | Providence | 11 | 9.9 | + 1.1 |
| 30 | Millie Rose Sirum | Providence | 10 | 7.5 | + 2.5 |


